AI-native professional market workspace

Professional market workflows,
built around what you trade.

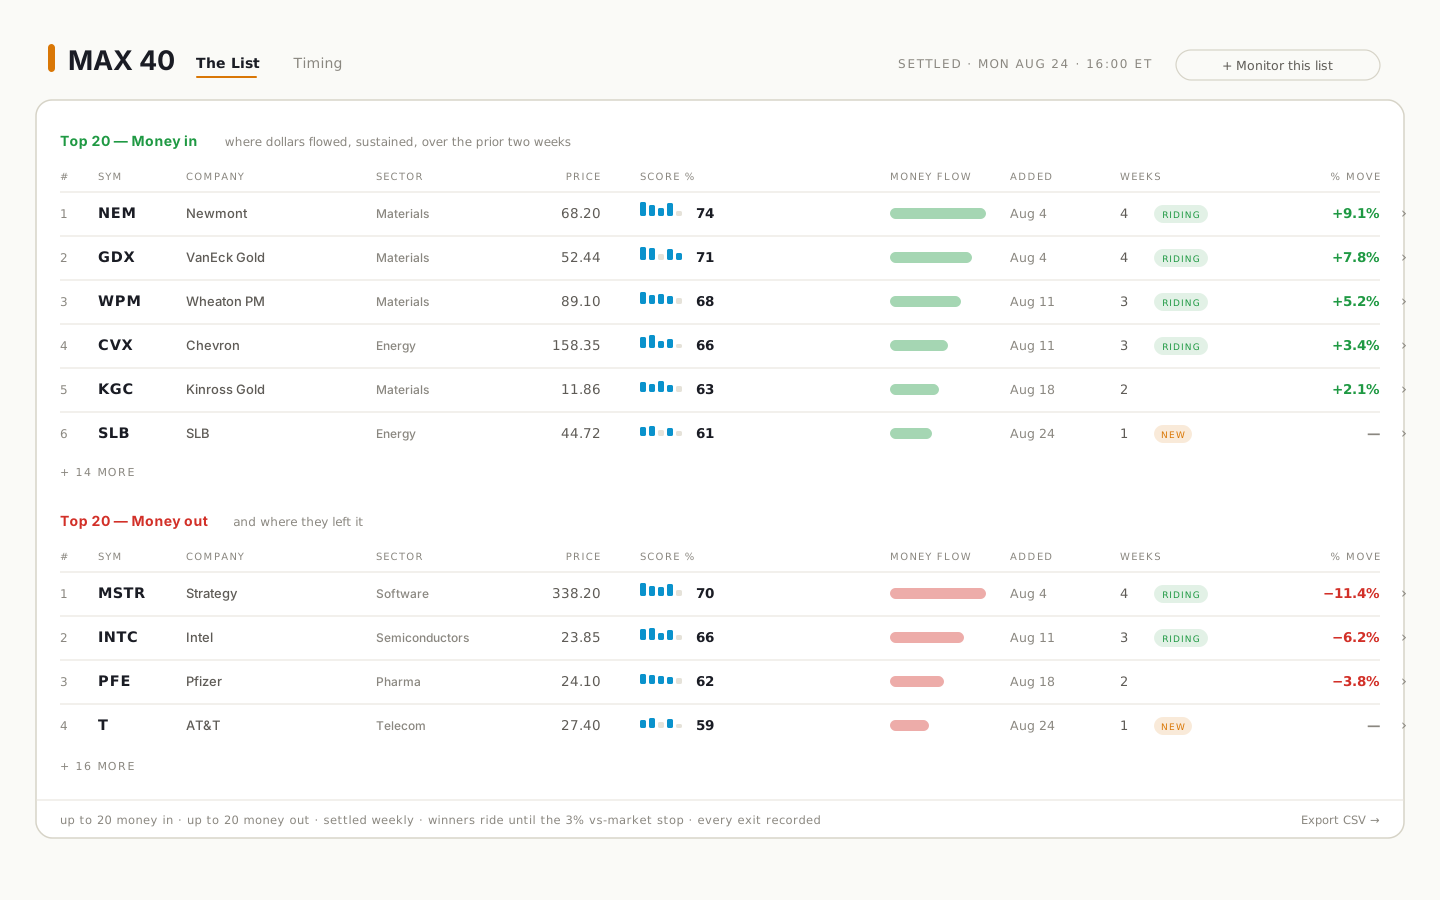
Screen markets, run expert-built Pro Strategies, work inside specialized Pro Surfaces, explore institutional-grade live and historical data, build dashboards, and monitor what matters — all in one workspace.

Start with your market

Screen the full equity universe, run stock-focused Pro Strategies, study price structure in dedicated surfaces, research flow and fundamentals, and monitor the names that matter to you.Work live options chains in a dedicated builder — discover, construct, and evaluate multi-leg structures, study volatility and positioning, and monitor the setups you build.Study stitched continuous contracts, commercial and speculative positioning, term structure, and session behavior — with dedicated surfaces for structure and timing.Screen majors and crosses on technical structure, study pairs against the macro regime, map levels and timing in dedicated surfaces, and monitor the pairs you trade.Screen the liquid crypto universe on technical and derivatives data, study structure and timing in dedicated surfaces, research on-chain and social context, and monitor around the clock.

Trade one market or five — your workspace starts with the tools, strategies, and data relevant to you.
$0 today · $295/mo after 7 days · or $2,499/yr (save 30%) · Informational analytics only. Trading involves risk.
Stocks · Screener
The stock screener with live filtered results
Options Pro · Live chain
Options Pro building a multi-leg structure on a live chain
Futures · Screener
The screener on the futures tab with positioning radar columns
Forex · Screener
The screener on the forex tab with majors and crosses
Crypto · Screener
The screener on the crypto tab with the liquid universe
Fibonacci Pro · TDY
TDY in Fibonacci Pro with confluence clusters and timing windows
Pro Strategy · Earnings Run-Up
The Earnings Run-Up Pro Strategy with candidates and studies
Fibonacci Pro · ES
Fibonacci Pro mapping confluence and timing on ES
Fibonacci Pro · EUR/USD
Fibonacci Pro mapping retracement clusters on EUR/USD
Crypto Dashboard
A crypto dashboard with live market tiles
Monitors
Active monitors with recent events

Professional methods, built into dedicated workspaces.

Developed with institutional traders, fund managers, and professional instructors: each Pro Surface codifies a specific methodology into a purpose-built interface — the data, controls, calculations, and visualization that method requires. Not another generic chat window.

Stock traders work price structure in Fibonacci Pro and read institutional positioning through the options lens in Options Pro.Options traders live in Options Pro — live chains, multi-leg construction, payoff modeling — with Fibonacci Pro mapping the underlying’s structure.Futures traders map swing structure and timing windows in Fibonacci Pro — price confluence and time symmetry on the contracts they trade every session.FX traders run retracement clusters, symmetry, and timing windows in Fibonacci Pro — a methodology built for how currency pairs actually move.Crypto traders map golden-pocket clusters and timing windows in Fibonacci Pro — structure and symmetry on a market that never closes.

PRO SURFACE

Fibonacci Pro

Map Fibonacci price relationships, time sequences, time-price opportunity, symmetry, and confluence in a focused analytical environment — golden-pocket clusters in gold, timing windows in cyan, drawn on live charts you control.

  • Where do retracement and extension clusters agree?
  • Which timing windows line up with price confluence?
  • Does the current swing show symmetry with prior legs?
Runs on live and historical multi-timeframe price data across stocks, futures, forex, and crypto — honor your own swings or let the surface propose them.
Fibonacci Pro — price confluence and time symmetry, one study surface
Fibonacci Pro — confluence clusters and timing windows on a live chart
Fibonacci Pro — price confluence and time symmetry, one study surface
Open Fibonacci Pro on any symbol →
PRO SURFACE

Options Pro

A dedicated environment for discovering, constructing, and evaluating multi-leg options structures — live chains, a visual position builder, payoff modeling, and a structure library of 35+ professional patterns.

  • Which structure fits this read — and at which strikes?
  • What does the payoff look like across price and time?
  • How does the position behave as volatility moves?
Runs on live options chains with real quotes and Greeks — institutional-grade options data you won’t get from an open-internet chatbot.
Options Pro — build multi-leg structures on the live chain
Options Pro — multi-leg builder on a live options chain
Options Pro — build multi-leg structures on the live chain
Build your first structure →

How it feels to work here.

One real thread, followed through a working day — every screenshot below is the actual platform running this exact workflow.

07:12
Read the room

Coffee and the dashboards. The almanac frames the day — regime, seasonality, what’s on the docket.

09:15
Run Earnings Run-Up

One click, market-wide. The strategy screens thousands of names and studies every candidate — today it surfaces TDY: a clean moving-average stack, eleven days out from the report.

Earnings Run-Up strategy run surfacing TDY with study steps
09:40
Study it in Fibonacci Pro

TDY on the chart: retracement clusters, timing windows, symmetry with the prior leg — the method, worked properly.

TDY in Fibonacci Pro with confluence clusters and timing windows
10:05
Structure it in Options Pro

Into the live chain: a defined-risk structure, the payoff modeled across price and time, real quotes and Greeks.

10:20
Hand it to MAX

“Alert me if TDY closes above 660, or if unusual options activity fires.” Two monitors, live. Walk away.

Two active TDY monitors watching price and options activity
14:14
The workspace taps you

A monitor fires. You reopen the study, weigh it, decide — and get back to your day. The research is always where you left it.

Put professional methods to work across the market.

A Pro Strategy is a screener with the method built in: it screens the market, finds the candidates, and runs the studies on each one — automatically.

Each one encodes a professional methodology end to end, so you review consistent, method-driven research instead of doing the sweep by hand.

01
Market universe
the eligible instruments
02
Strategy criteria
the method’s screen
03
Candidates
what qualifies today
04
Professional study
the method, applied
05
Research results
consistent, reviewable
PRO STRATEGY
Earnings Run-Up

Screens the equity universe for names entering their historically strongest pre-earnings window, then runs momentum, revision, and positioning studies on every candidate.

PRO STRATEGY
Golden Pullback

Finds market leaders pulling back to structure and runs trend, level, and leadership studies against each one — consistent, method-driven results.

PRO STRATEGY
Earnings Run-Up

Surfaces names entering their strongest pre-earnings window — prime candidates for defined-risk structures built in Options Pro.

PRO STRATEGY
Golden Pullback

Finds leaders pulling back to structure — then you take the candidate into the chain and build the structure that fits your read.

PRO STRATEGY
Golden Pullback

Applies the pullback methodology across the board — leaders retracing to structure, each candidate studied for trend and level quality.

PRO STRATEGY
Earnings Run-Up

Equity-index traders use the earnings-window lens on the names that drive the index — context for how the tape trades into the dates.

PRO STRATEGY
Golden Pullback

The pullback methodology applied to currency pairs — trending pairs retracing to structure, studied for level quality and continuation.

PRO STRATEGY
Earnings Run-Up

Event-window discipline translates: the same screening-and-study workflow, pointed at the calendar that moves your pairs.

PRO STRATEGY
Golden Pullback

Leaders pulling back to structure, around the clock — every candidate studied for trend and level quality before it reaches you.

PRO STRATEGY
Earnings Run-Up

The event-window workflow, pointed at crypto catalysts — screening first, then structured studies on every candidate.

A real Earnings Run-Up run — the universe screened, TDY surfaced, every study applied
A Pro Strategy run — candidates identified and studies applied
A real Earnings Run-Up run — the universe screened, TDY surfaced, every study applied

Start with the market, not a ticker.

Filter 10,000+ equities on live and computed data — trend, momentum, volume, levels — then move straight into a surface, strategy, or monitor.Screen the underlyings first — trend, momentum, volatility context — then jump straight from a result into the chain and start structuring.Screen the futures board with positioning-aware columns — trend, momentum, and the positioning radar — then open a surface on the contract that sets up.Filter majors, minors, and crosses on live technical structure — trend, momentum, volatility — then take a pair into a surface or set a monitor on the level.Filter the liquid crypto universe on live technical structure and derivatives context — then open a surface on the coin, or set a monitor and walk away.

Above 200-dayRSI(14) < 35Rel. volume > 2×New 20-day highSemiconductorsHigh IV rankEarnings < 14dAbove 50-dayLiquid weekliesRel. volume > 1.5×UptrendCOT: commercials net-longAbove weekly VWAPEnergy complexPositioning radarMajorsDowntrendATR expandingBelow 200-dayJPY crossesTop 100 by capUptrendFunding neutralAbove 50-dayNew 30-day high
The screener — shelf-fast results across the whole market, with saved screens
The screener on the stocks tab with live filtered results
The screener — shelf-fast results across the whole market, with saved screens
The screener on the options tab with live filtered results
The screener — shelf-fast results across the whole market, with saved screens
The screener on the futures tab with live filtered results
The screener — shelf-fast results across the whole market, with saved screens
The screener on the forex tab with live filtered results
The screener — shelf-fast results across the whole market, with saved screens
The screener on the crypto tab with live filtered results
The screener — shelf-fast results across the whole market, with saved screens
Result Pro Surface
Result Monitor
Result Dashboard
Result Full analysis

Built on dedicated market data — not web summaries.

Market Agent X connects your workflows to institutional-grade live and historical feeds — market structure, flow, positioning, fundamentals, macro, sentiment — plus proprietary computed studies. Purpose-built market infrastructure, not a general-purpose chat tool summarizing public webpages.

Live options chains
Real quotes and Greeks across every listed US options exchange — the data Options Pro builds on.
Historical depth
Years of price history and seasonal behavior behind the almanac, screens, and studies.
Computed studies
Volume profile, anchored VWAPs, positioning radar, confluence clusters — derived in-house, continuously.
Source attribution
Every research output cites the data behind it. You can audit the reasoning, not just read a conclusion.

Six categories of dedicated market data, flowing into every surface, strategy, screen, dashboard, and monitor you run.

MARKET DATA
Real-time price, liquidity & market structure
  • 100K+ stock tickers · 70+ exchanges
  • OPRA feed (all 17 US options exchanges)
  • 2,500+ FX pairs across institutional LPs
  • 4,000+ crypto pairs · 25+ exchanges
SMART MONEY & ON-CHAIN
Track smart money, whales & on-chain activity
  • 300M+ labeled wallets (Smart Money, Whale, Fund, VC, MEV bot)
  • Cohort-level flow (Funds / Smart Traders / Whales) over 7 / 30 / 90 days
  • Exchange flows across 20+ major venues
  • Miner-pool data across all major pools
MACRO & CROSS-MARKET
Macro indicators & cross-asset market context
  • DXY · VIX · US10Y · SPX · Gold · Oil · Bonds
  • S&P · Nasdaq · FTSE · DAX · Nikkei · Hang Seng + 50
  • Economic calendar + earnings calendar
  • 5,000+ ETFs · cross-asset correlations
MARKETAGENTX
DATA & RESEARCH CORE
Dedicated live and historical feeds, normalized and computed into the studies your workflows run on.
DERIVATIVES & FLOW
Institutional positioning & derivatives intelligence
  • Options flow + dark pool (FINRA ATS, ~50 venues)
  • 700+ perps across 30 derivatives exchanges
  • Politician trades · 535 House + Senate members
  • Insider Form 4 + lobbying + ETF flows
SENTIMENT & SOCIAL
Real-time sentiment, narratives & crowd intelligence
  • Twitter/X firehose · 4,000+ tracked cashtags
  • Reddit · YouTube · TikTok · Telegram · Discord
  • Dev activity from every public crypto GitHub repo
  • 3,500+ news outlets aggregated
DEFI & ECOSYSTEM
On-chain DeFi data & ecosystem health
  • 300+ chains (Ethereum, Solana, Tron, Base, Sui +296)
  • 4,500+ protocols (Aave, Lido, EigenLayer, Uniswap +4,490)
  • 200+ stablecoins · per-chain supply tracking
  • Hacks DB · raises DB · unlocks calendar
POWERING YOUR WORKSPACE
Screener
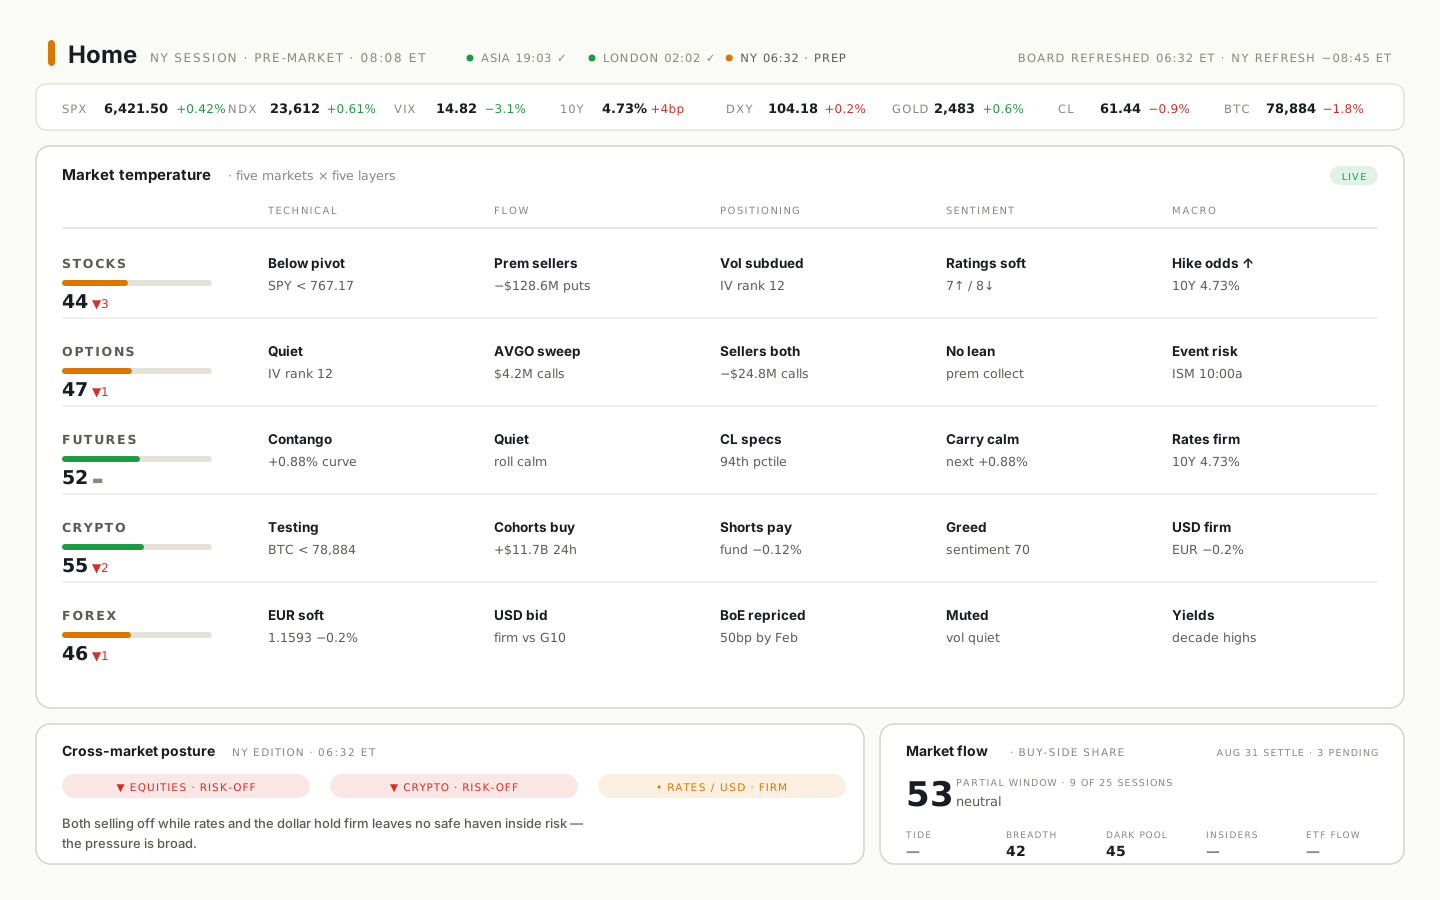
Filter the whole market on live and computed data
Pro Surfaces & Strategies
Professional methods, running on professional data
Dashboards & Monitors
Organize the market and get notified when it changes
100+
DATA ENDPOINTS
24/7
REAL-TIME UPDATES
LIVE
OPTIONS CHAINS & FLOW
5
MARKETS · STOCKS · CRYPTO · FOREX · FUTURES · OPTIONS

100+ data signals, feeding every workflow in your workspace.

A workspace that stays useful after the first question.

Dashboards

Organize the market around the instruments, strategies, sectors, themes, or conditions you follow. Built-ins to start, a custom builder when you outgrow them — synced everywhere.

A custom dashboard — your market, arranged your way
A custom dashboard with live market tiles
A custom dashboard — your market, arranged your way

Monitors

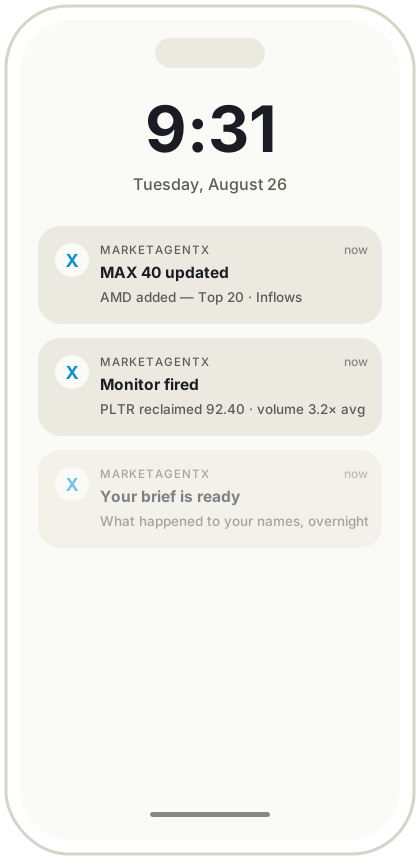
Tell MAX what to watch in plain English. Persistent monitors run against live data and notify you the moment defined conditions change — across every market, around the clock.

Monitors — conditions defined once, watched continuously
The monitors hub with recent events
Monitors — conditions defined once, watched continuously

Almanac

Seasonal behavior, recurring events, and calendar context — how this instrument has traded through this window in prior years, with the sample sizes shown honestly.

The almanac — seasonal structure and event context
Seasonality almanac tiles
The almanac — seasonal structure and event context

Historical research

Compare present conditions with prior behavior, investigate patterns, and validate ideas against years of history — in the same workspace where you found them.

MAX works across your process — not only at the end of it.

MAX is the intelligence layer connecting the workspace. Use plain English to launch a screen, run a Pro Strategy, open a Pro Surface, query live or historical data, generate a dashboard, create a monitor, or start a structured analysis — every tool in the platform, one conversation away.

Screen semiconductors above the 200-day with rising relative volume
Run Golden Pullback across the market
Open Fibonacci Pro on ES and honor my swing from the June low
Build me a dashboard for my energy names
Monitor EUR/USD for a daily close below 1.07
What does the almanac say about this week, historically?
Run a full analysis on NVDA

Need a complete instrument analysis?

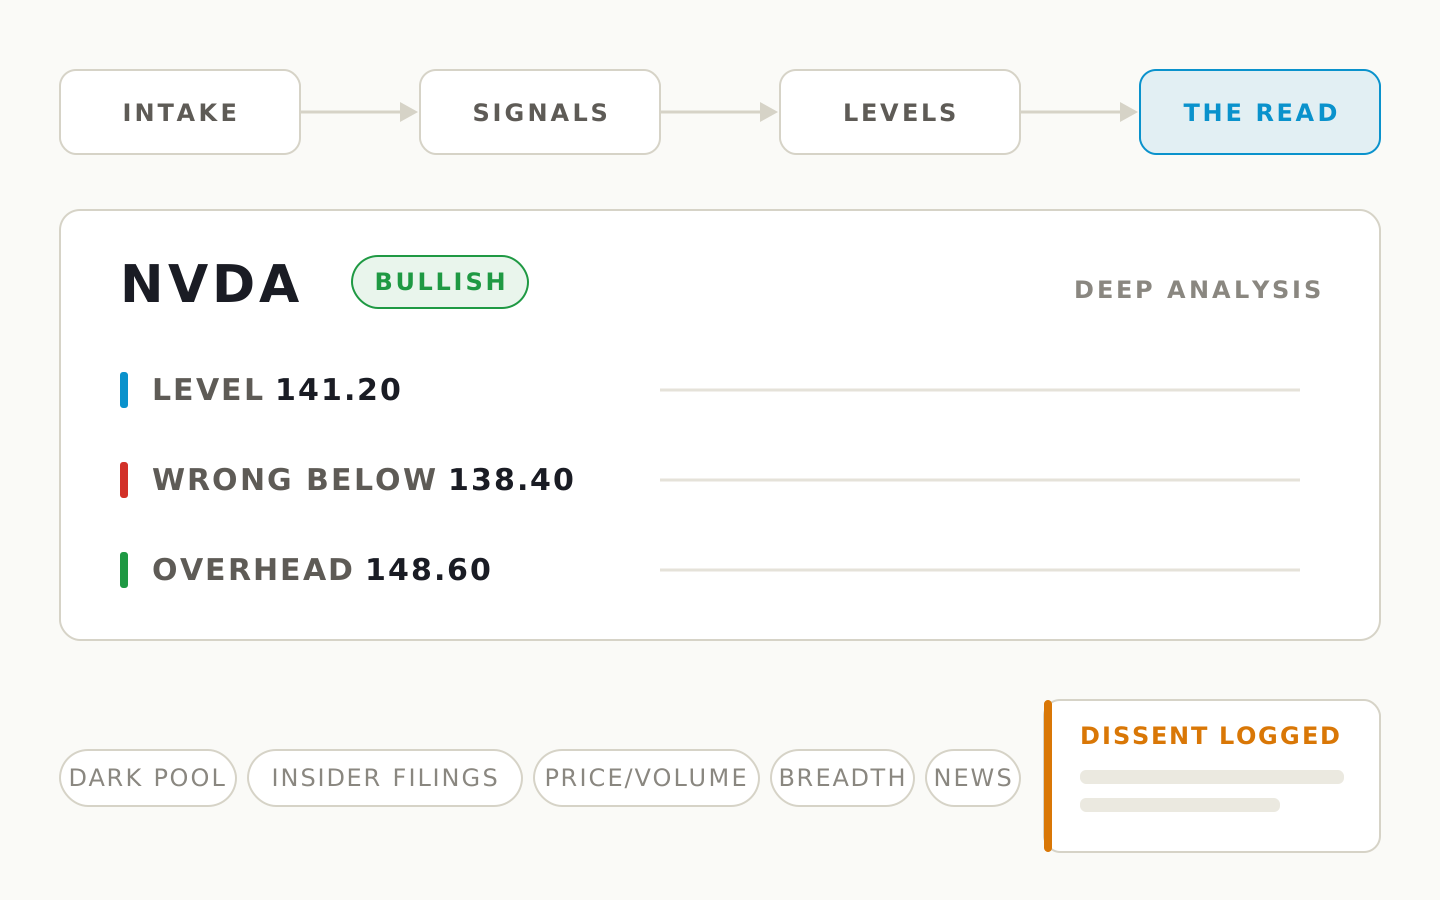
Run a structured, multi-stage analysis across the data layers relevant to the instrument and its market. MAX returns a directional bias, the evidence supporting it, the signals conflicting with it, the market regime, the levels that matter, and the sources behind every claim — reasoning you can audit, not a conclusion you have to trust.

DISCOVERY
Scanning candidate universe across markets
SCANNING
FLOW
Unusual options flow — $250k+ filter, last 60min
STREAMING
SMART MONEY
Cohort attribution from labeled wallets + funds
MAPPING
POSITIONING
Dealer gamma + COT + dark-pool prints
COMPUTING
SENTIMENT
Social + creator-level signal mapping
READING
MACRO
Cross-asset regime — rates, FX, credit, vol
CORRELATING
TECHNICAL
Levels engine — VWAP, value area, fibs, anchored
COMPUTING
REASONING
MAX synthesizing the read across 7 layers
WRITING
LAYER
NVDAFULL ANALYSIS
BULLISH BIASsupports5/7 layersconflicts2
RegimeRisk-on
VWAP$144.80
VAH$147.20
SourcesCited
Supporting: dealer gamma short above $147, $250k+ call sweeps stacking through $150c, risk-on macro, social inflection 47 minutes ago. Conflicting: valuation layer stretched, crowding elevated. Every claim cites its layer and source.
Directional bias
Where the weight of evidence points
Supporting & conflicting evidence
Both sides, always — dissent is rendered, not hidden
Regime & levels
The context and the prices that matter
Source context
Every layer cited — audit the reasoning
A full analysis — bias, evidence, conflicts, and sources in one study
A completed full analysis with directional bias, evidence, and sources
A full analysis — bias, evidence, conflicts, and sources in one study

The whole professional stack, in one subscription.

The stack you’d otherwise assemble
  • Whole-market screener$30–80/mo
  • Options analytics platform$60–150/mo
  • Institutional data subscriptions$200–800/mo
  • Charting & technical studies$30–60/mo
  • Historical & seasonal research$50–100/mo
  • Alerting & monitoring tools$20–50/mo
  • Stitching it all together yourselfhours/week
$390–$1,240+/moacross six tools that don’t talk to each other
Market Agent X
  • Screener, Pro Surfaces, and Pro Strategies in one workspace
  • Institutional-grade live & historical data included
  • Dashboards, monitors, almanac, and full analysis built in
  • MAX connects it all in plain English
  • Stocks · options · futures · forex · crypto — one stack
$295/moor $2,499/yr · start with one market, expand without changing platforms
ALL-ACCESS
7 days free, then
$295/mo

Every market, every surface, every strategy — one subscription.

Pro Surfaces — Fibonacci Pro & Options Pro workspaces
Pro Strategies — screeners with the method built in
Whole-market screener — stocks, crypto, forex, futures
Institutional-grade live & historical data, incl. live options chains
Custom dashboards for any instrument, sector, or theme
Monitors that notify you when conditions change
Seasonality almanac & years of historical context
Full multi-stage analysis with directional bias & sources
MAX — run all of it in plain English
New Pro Surfaces & Strategies included as they ship
Start 7-Day Trial — $0 Today
Card required to begin. Billed $295/mo on day 7 unless you cancel.
Cancel anytime.

Before you start the trial.

What is a Pro Surface?
A Pro Surface is a purpose-built workspace for a specific professional analytical or strategy discipline — developed with institutional traders, fund managers, and professional instructors. Fibonacci Pro codifies Fibonacci price relationships, time sequences, and symmetry into a dedicated study surface; Options Pro is a dedicated environment for discovering, constructing, and evaluating multi-leg options structures on live chains. Each surface gets the data, controls, calculations, and visualization its method requires.
What is a Pro Strategy?
A screener with the method built in. A Pro Strategy screens a market universe against a professional methodology, identifies the candidates that qualify, and automatically runs the corresponding studies on each one — so you review consistent, method-driven research results. You can run one market-wide or point it at a single ticker.
Can I focus on just one market?
Yes. Your workspace starts with the tools, strategies, and data relevant to the market you trade — stocks, options, futures, forex, or crypto. Everything else is there when you want it. Start with one market; expand without changing platforms.
What live and historical data is available?
Dedicated institutional-grade feeds across all five markets: live prices and market structure, live options chains with quotes and Greeks, flow and positioning, fundamentals, macro, and sentiment — plus years of price history and seasonal context, and proprietary computed studies like volume profile, anchored VWAPs, and confluence clusters. This is purpose-built market infrastructure, not summaries of public webpages.
Can I inspect the sources behind an answer?
Yes. Research outputs cite the data layers and sources behind them — what the flow layer saw, what positioning returned, what the macro regime was. You can audit the reasoning, not just read a conclusion.
Can I build custom dashboards and monitors?
Yes. Dashboards organize the market around the instruments, sectors, themes, or conditions you follow — built-ins to start, a custom builder when you outgrow them. Monitors run continuously against live data and notify you the moment your defined conditions change, in any market.
What does a Full Analysis provide?
A structured, multi-stage study of a single instrument across the data layers relevant to its market. It returns a directional bias, the evidence supporting it, the signals conflicting with it, the market regime, key levels, and source context. It is research — not a personalized recommendation or an instruction to trade.
Is Market Agent X financial advice?
No. Market Agent X provides informational market analysis and research tooling only. You decide whether to trade, how to size, and where to execute. Nothing on the platform constitutes a personalized recommendation.
Does MAX execute trades for me?
No. Market Agent X is a research and analysis workspace. Execution stays with your broker, exchange, or trading platform — we don’t hold funds or move capital.

Professional methods. Professional data.
A workspace focused on your market.

Screen the market. Run Pro Strategies. Work inside Pro Surfaces. Research institutional-grade live and historical data. Build dashboards. Set monitors. And when you need it, run a full multi-stage analysis. One workspace, built around what you trade.

Start Your 7-Day Trial
$0 today · $295/mo after 7 days · or $2,499/yr (save 30%)