Features are easy to list and hard to feel. A chain view here, a screener there, a briefing somewhere else — every platform has a feature grid. What matters is whether the pieces form a workflow: does the output of one step become the input of the next, or do you spend your day copying tickers between tabs?
So instead of a tour, here's a day. One trader, one thread of research, morning to close — and then the part that happens after you walk away.
Morning — the read
The day starts in chat, because that's where MAX delivers the Daily Brief: the docket of what's scheduled — reports, releases, expirations — the almanac context for where the calendar sits historically, and a market read built from the overnight data. Ten minutes of reading that replaces an hour of tab-cycling, and more importantly, it's the same brief every day, so you notice what changed.
From the brief, two quick stops. The Seasonality dashboard shows where the current stretch of the calendar has historically leaned — now, the path ahead, the month, the year at a glance. Then the Stocks Overview dashboard for the live picture: price, levels, flow, positioning. Neither stop is about finding a trade. They're about calibration — knowing what kind of day you're operating in before you go looking for anything.
Every study you run later today will be interpreted through a regime. Reading the brief and the almanac first means you set that context deliberately, instead of inheriting it from whichever headline you saw last.
Mid-morning — run the method
Calibrated, you go looking. Earnings season is on, so from the chat home box you launch the Earnings Run-Up Pro Strategy — market-wide. It screens the universe of upcoming reporters and runs its studies on every candidate: the historically strong pre-earnings window, the moving-average stack quality, the calendar checks, the expected move, the structure candidates.
The run comes back with a ranked table, and one name has cleared everything: TDY, full stack — 20-day over 50 over 150 over 200 — roughly eleven days from its report, inside its historically strong window.
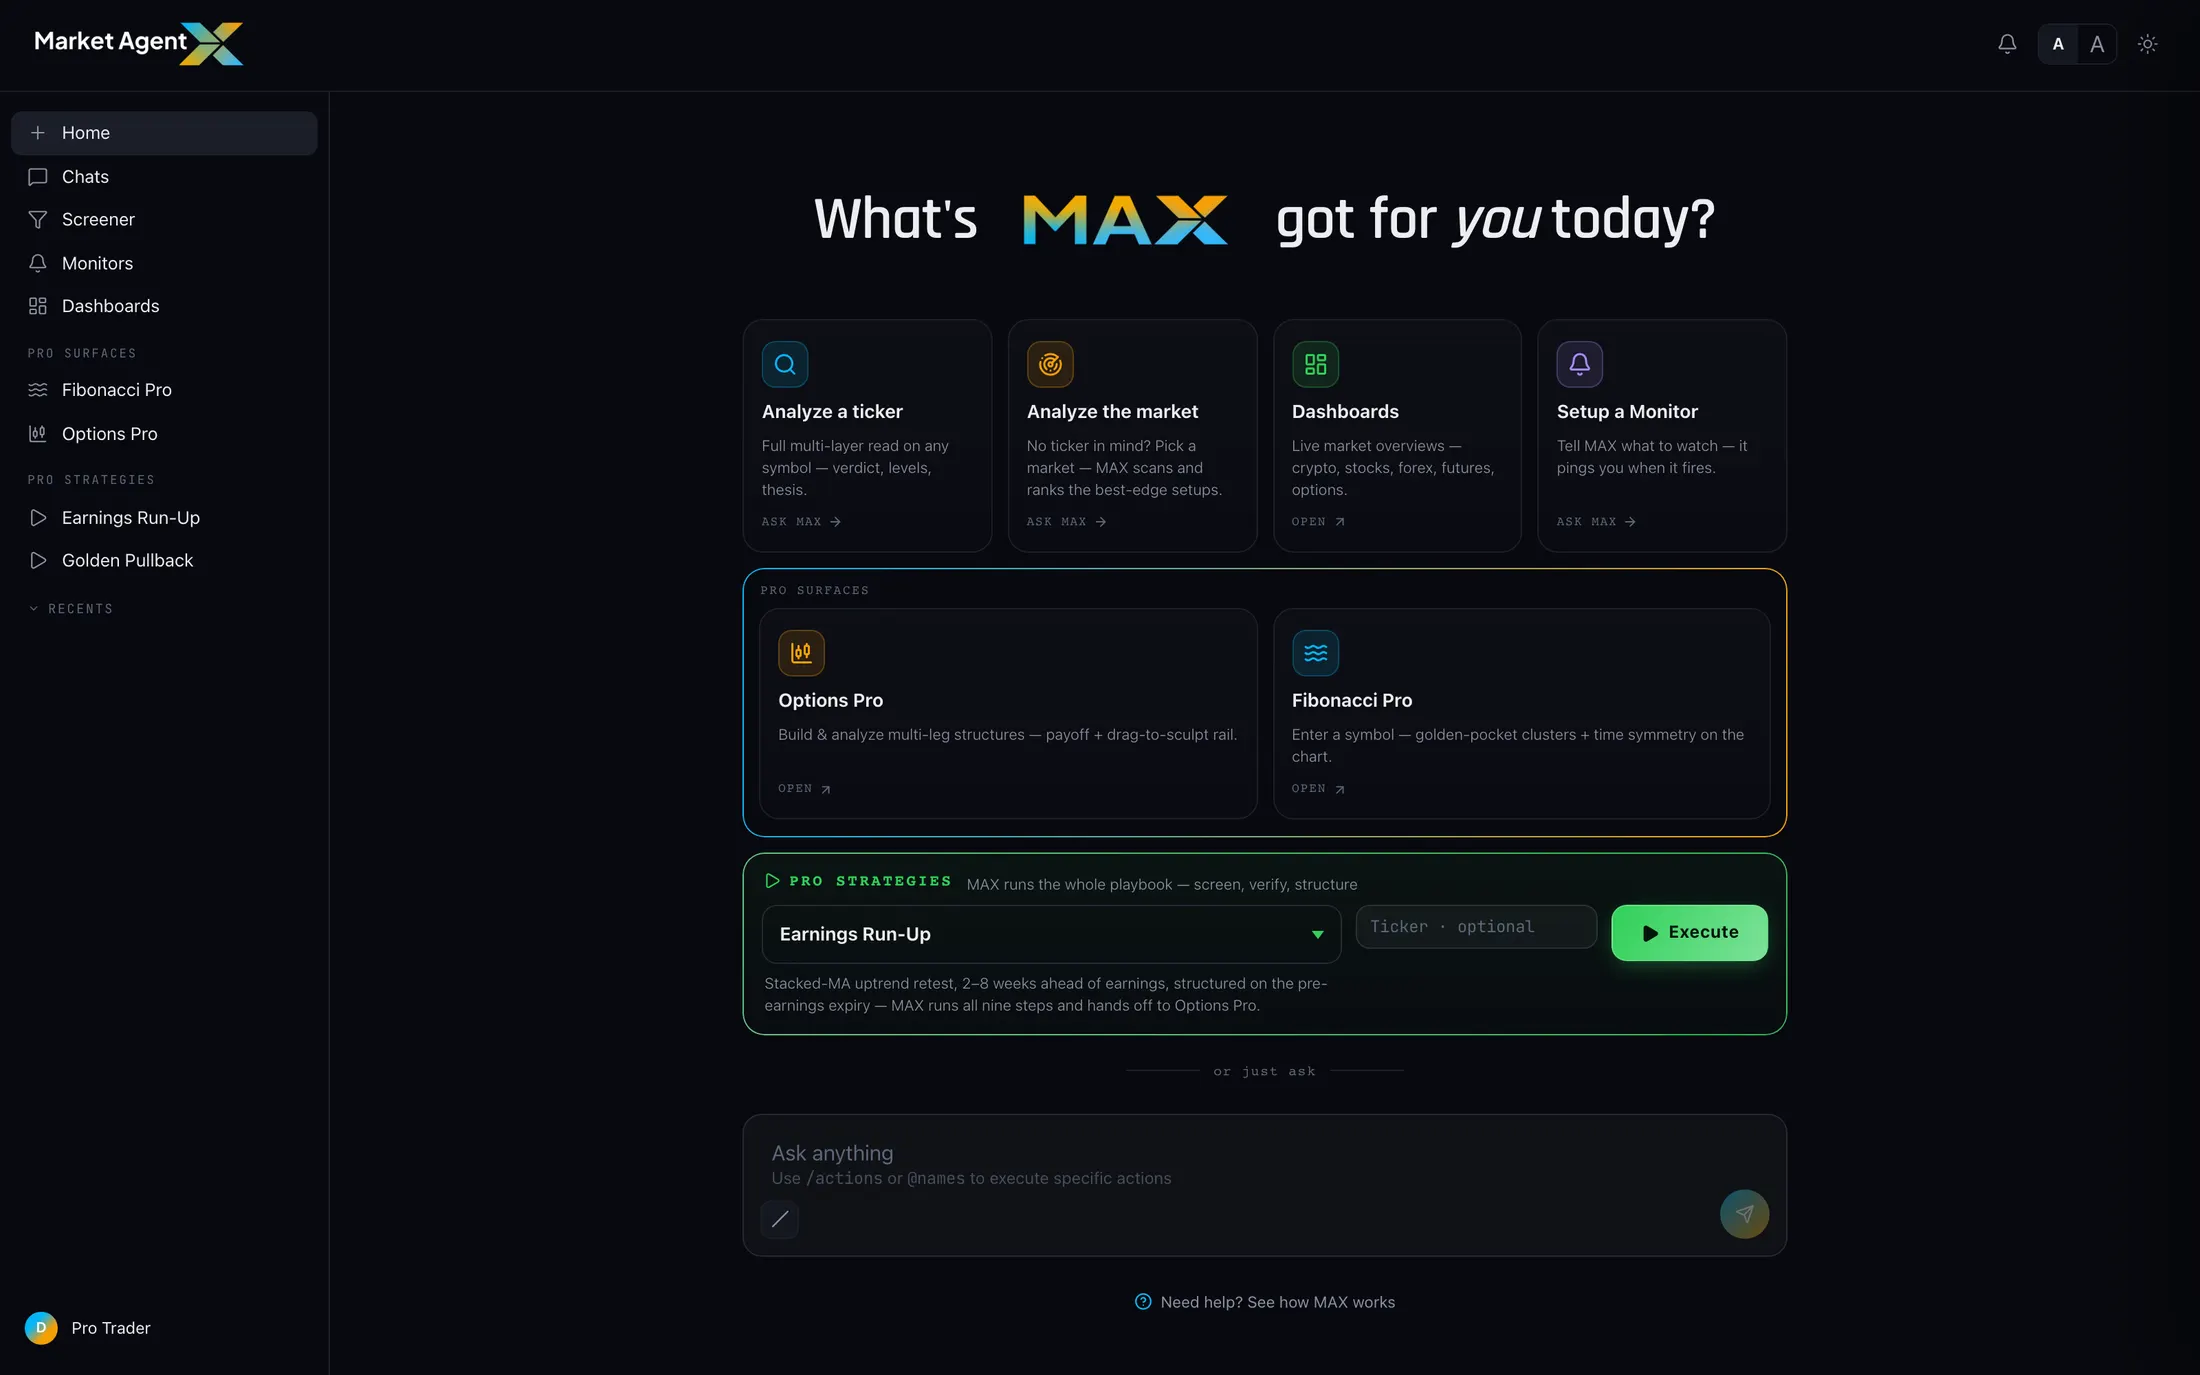
Note what just happened to your morning: you didn't build a screen, pull a calendar, or check a single moving average by hand. The method ran itself. Your job starts now, with one name instead of four hundred.
Late morning — study the winner
A candidate from a screen is a claim, and claims get tested. You carry TDY into Fibonacci Pro, the study surface for price and time structure.
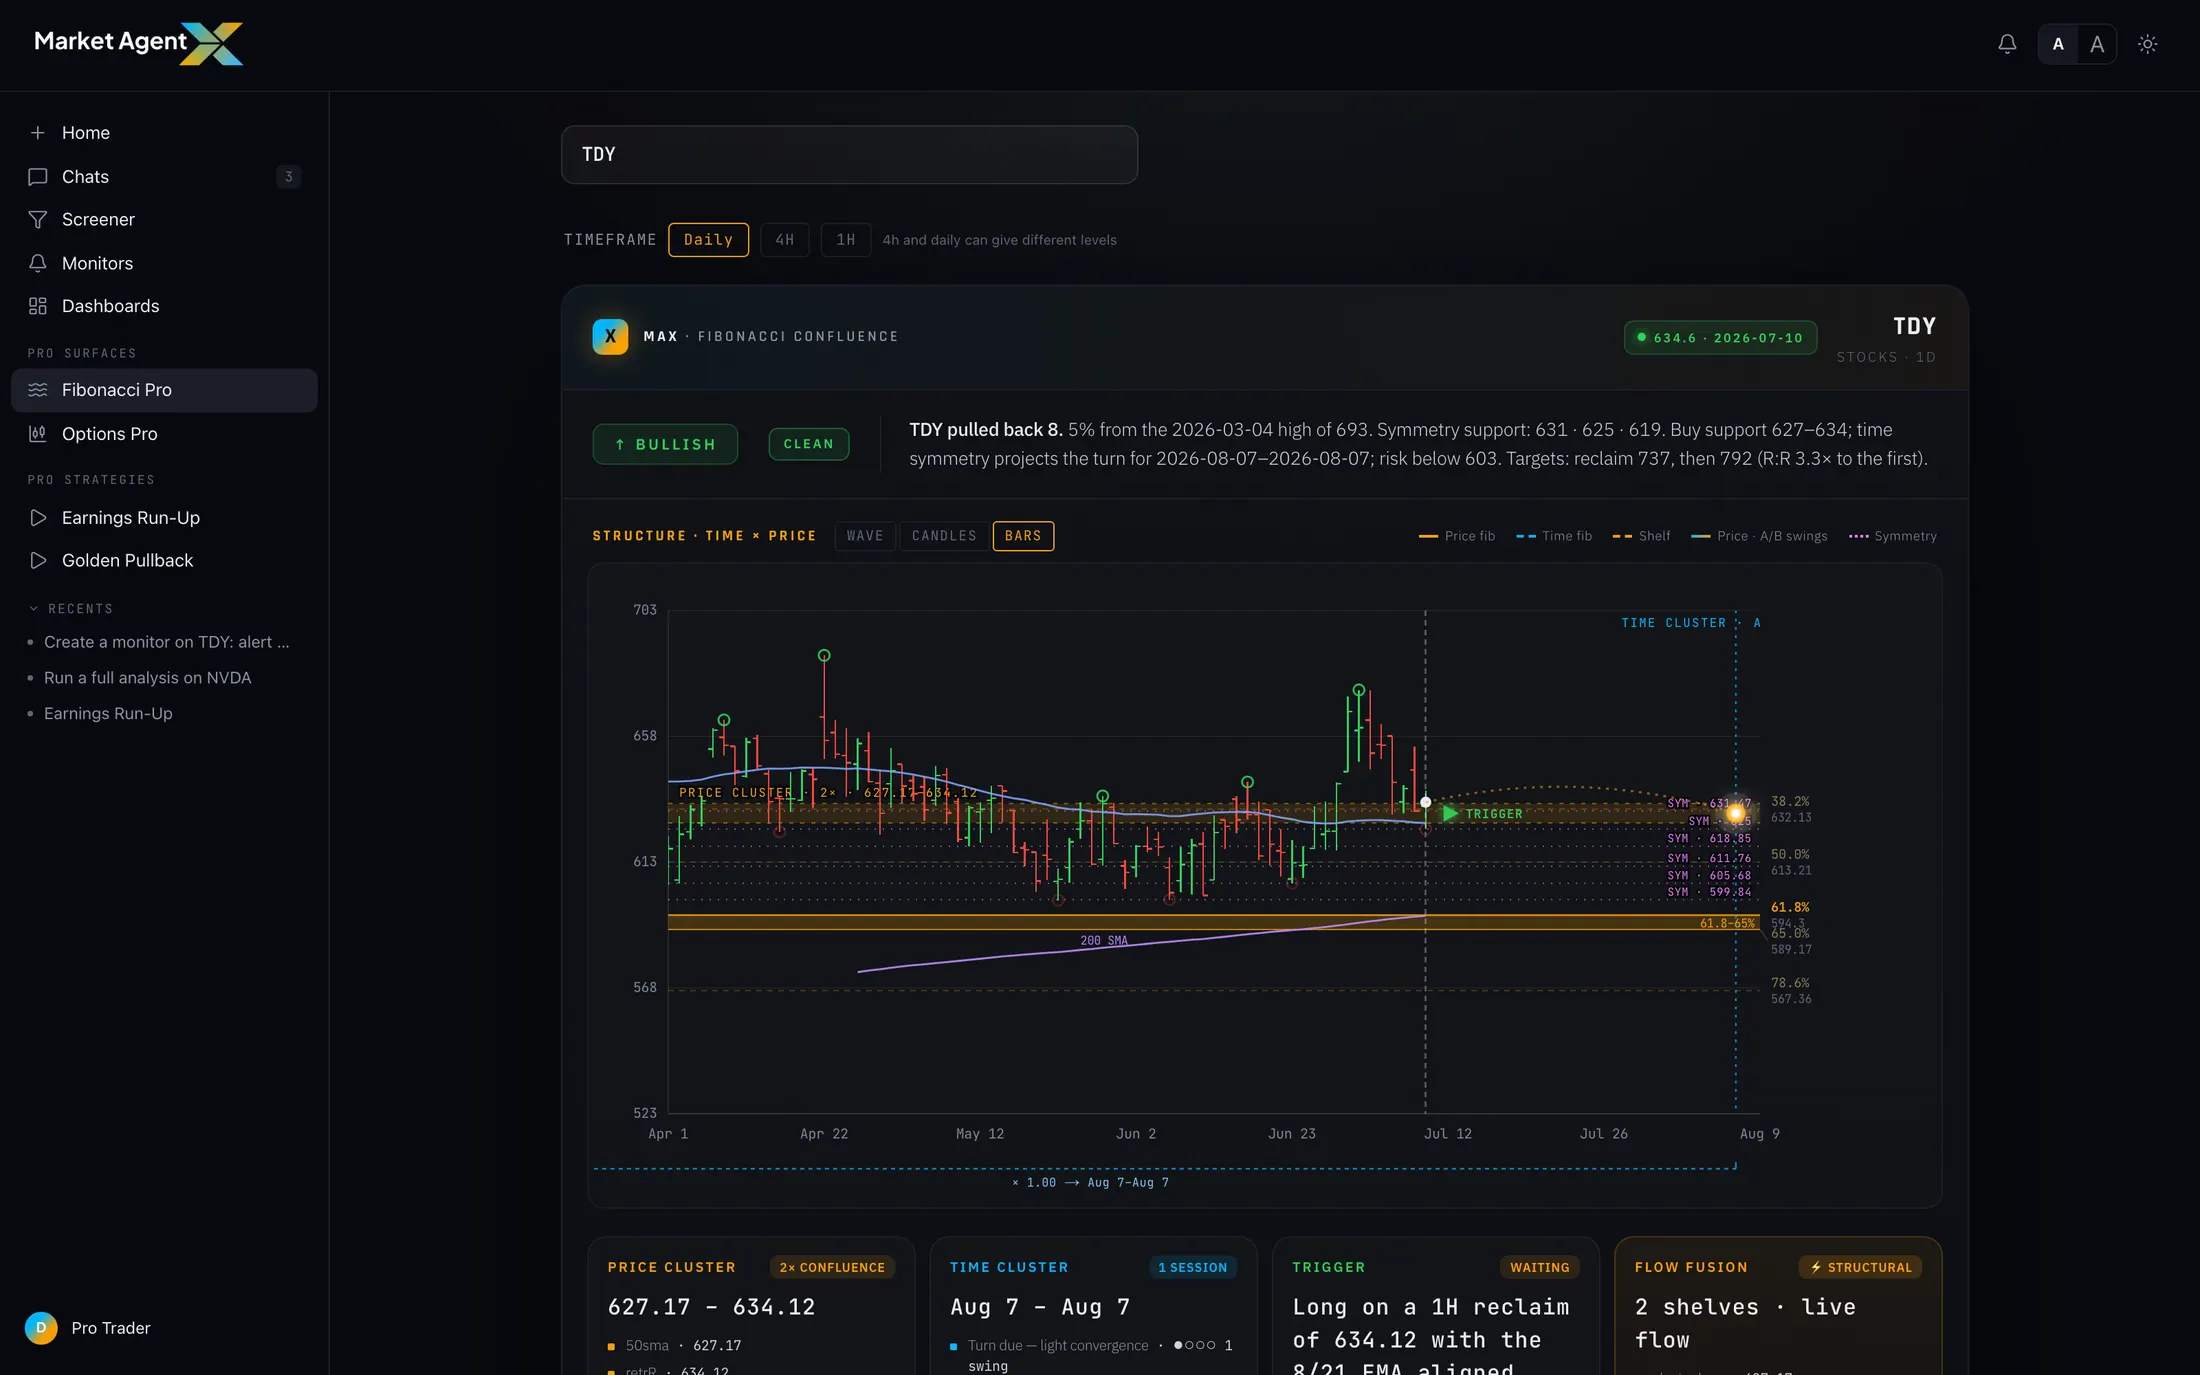
Two things you're looking for. First, the confluence clusters — where retracement levels, prior structure, and computed zones pile up at the same price. Those clusters are your map: where a pullback should hold if the trend is honest, where the move overhead starts running into supply. Second, the timing windows — because in this setup, time is literally the trade. The report is in eleven days; the study shows you how the price structure and the calendar line up, and whether the run-up has room before the event takes over.
The chart agrees with the screen. Structure below, room above, the window open. Now — how to express it.
Midday — structure it
Into Options Pro, where the strategy's structure candidates were already pointing. The live chain and flow are on screen; the expected move from the run gives you the yardstick. You work through the candidates in the visual builder — legs on a payoff diagram, strikes dragged against the levels you just studied in Fibonacci Pro, expiries chosen against the report date the run verified.
This is where the platform's pieces visibly interlock: the level came from Fibonacci Pro, the date and expected move came from the strategy run, and the payoff model shows what each candidate structure does across exactly that range and time. When one of them fits — risk defined, structure aligned with the study — you export it to your trading platform. Market Agent X is the research workspace; execution stays wherever you execute.
Afternoon — set the tripwires and leave
The setup isn't live yet. The chart needs to do something first — and watching a chart wait is the worst use of a human. So you hand the waiting to MAX, in plain English: alert me if TDY closes above 660. And a second one for the tell that often precedes the move: watch TDY for unusual options activity.
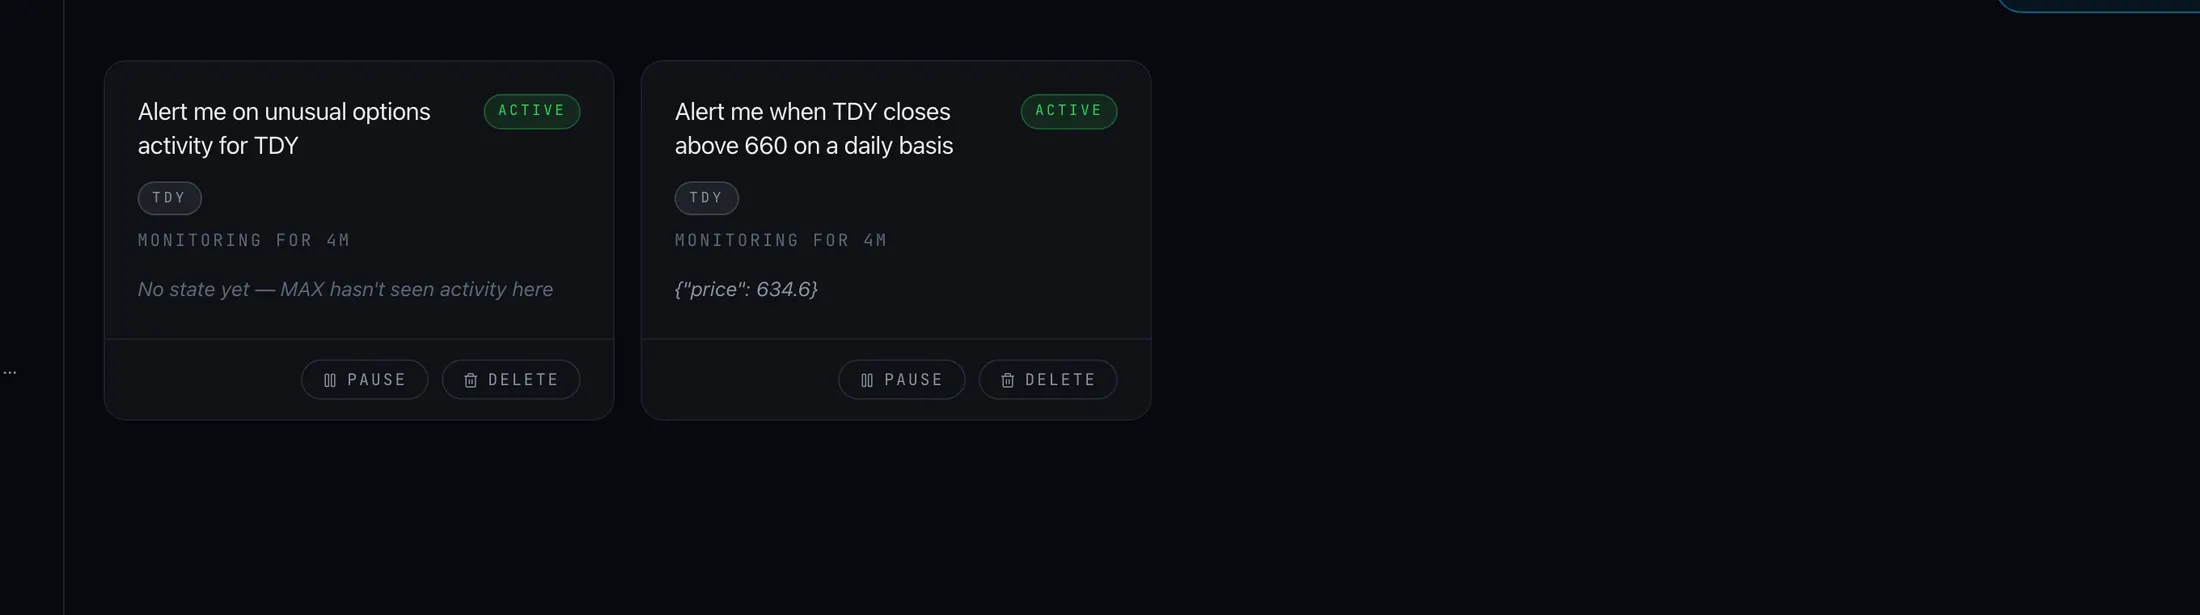
Then — and this is the part feature grids never capture — you close the laptop. The research is stored, the levels are mapped, the structure is built, and the conditions are being watched by something that doesn't get bored, doesn't refresh the quote out of anxiety, and doesn't miss a close.
Days later — the monitor fires
Tuesday, after the close: the alert lands. TDY closed above 660. The alert arrives with context — what fired, what the surrounding data looked like when it did — and everything you built is one click away: the strategy run, the Fibonacci Pro study, the structure in Options Pro. You re-check the chart against the levels, confirm the study still holds this side of the trigger, and make your decision with the whole file in front of you.
That decision — whatever it is — is yours. The platform's job was everything before it.
The shape of the day
Read
Daily Brief, almanac, dashboards. Calibrate before you hunt.
Screen
Run a Pro Strategy market-wide. Let the method surface the candidate.
Study
Test the candidate in Fibonacci Pro — structure in price, windows in time.
Structure
Build and pressure-test the expression in Options Pro against the expected move.
Monitor
Set the triggers in plain English and walk away. MAX holds the watch.
Five verbs, each feeding the next, with your attention spent only where judgment is actually required. That's not a feature list. That's a workday — and it's the thing Market Agent X was built to hold.
Run the whole day yourself
Brief to strategy run to study to structure to monitor — one connected workflow. Start your 7-day trial and see where a morning gets you.
Start 7-Day Trial →