There's a piece of market lore every earnings trader eventually tests for themselves: certain stocks tend to firm up in the days before they report. Not after the print — before it. Anticipation, positioning, pre-announcement drift, whatever you attribute it to, the pattern is measurable in the historical record, and it's measurable per name.
The problem was never the idea. The problem is the workload. To research it properly for even one earnings cycle you have to: pull the earnings calendar, check each name's historical behavior in its own pre-earnings window, confirm the trend is actually healthy right now, verify the report date, check for an ex-dividend date hiding inside your holding period, find option expiries that bracket the event, compute the expected move, and only then start thinking about how you'd structure a position. Multiply that by a few hundred reporting names and the research dies in a spreadsheet.
Earnings Run-Up is that entire process encoded as a Pro Strategy — a screener with the method built in. You run it, and every step above happens on every candidate, in order, automatically.
What the strategy actually encodes
A Pro Strategy isn't a filter — it's a sequence of studies. Earnings Run-Up runs these on each candidate:
The historical pre-earnings window
Does this specific name have a historically strong stretch heading into its reports? The strategy checks the name's own record — not a market-wide average — because pre-earnings behavior is deeply idiosyncratic. Some names drift up reliably; most don't.
Moving-average stack quality
A seasonal tendency in a broken chart is a trap. The strategy grades the trend by the order of the moving averages — ideally the 20-day above the 50, the 50 above the 150, the 150 above the 200. A full stack means every horizon of trend agrees; a partial stack gets flagged as lower quality.
Calendar verification
The earnings date is confirmed, and the window is checked for an ex-dividend date — the kind of detail that quietly changes the math on any options structure you might build around the event.
Expiries and expected move
The strategy pulls the live option expiries that bracket the report and computes the expected move the options market is pricing for the event — the number that tells you what a run-up would have to beat to matter.
Structure candidates
Finally, it proposes ways the setup could be expressed — structure candidates matched to the window, the expiries, and the expected move, ready to be studied in Options Pro.
A real run: how TDY surfaced
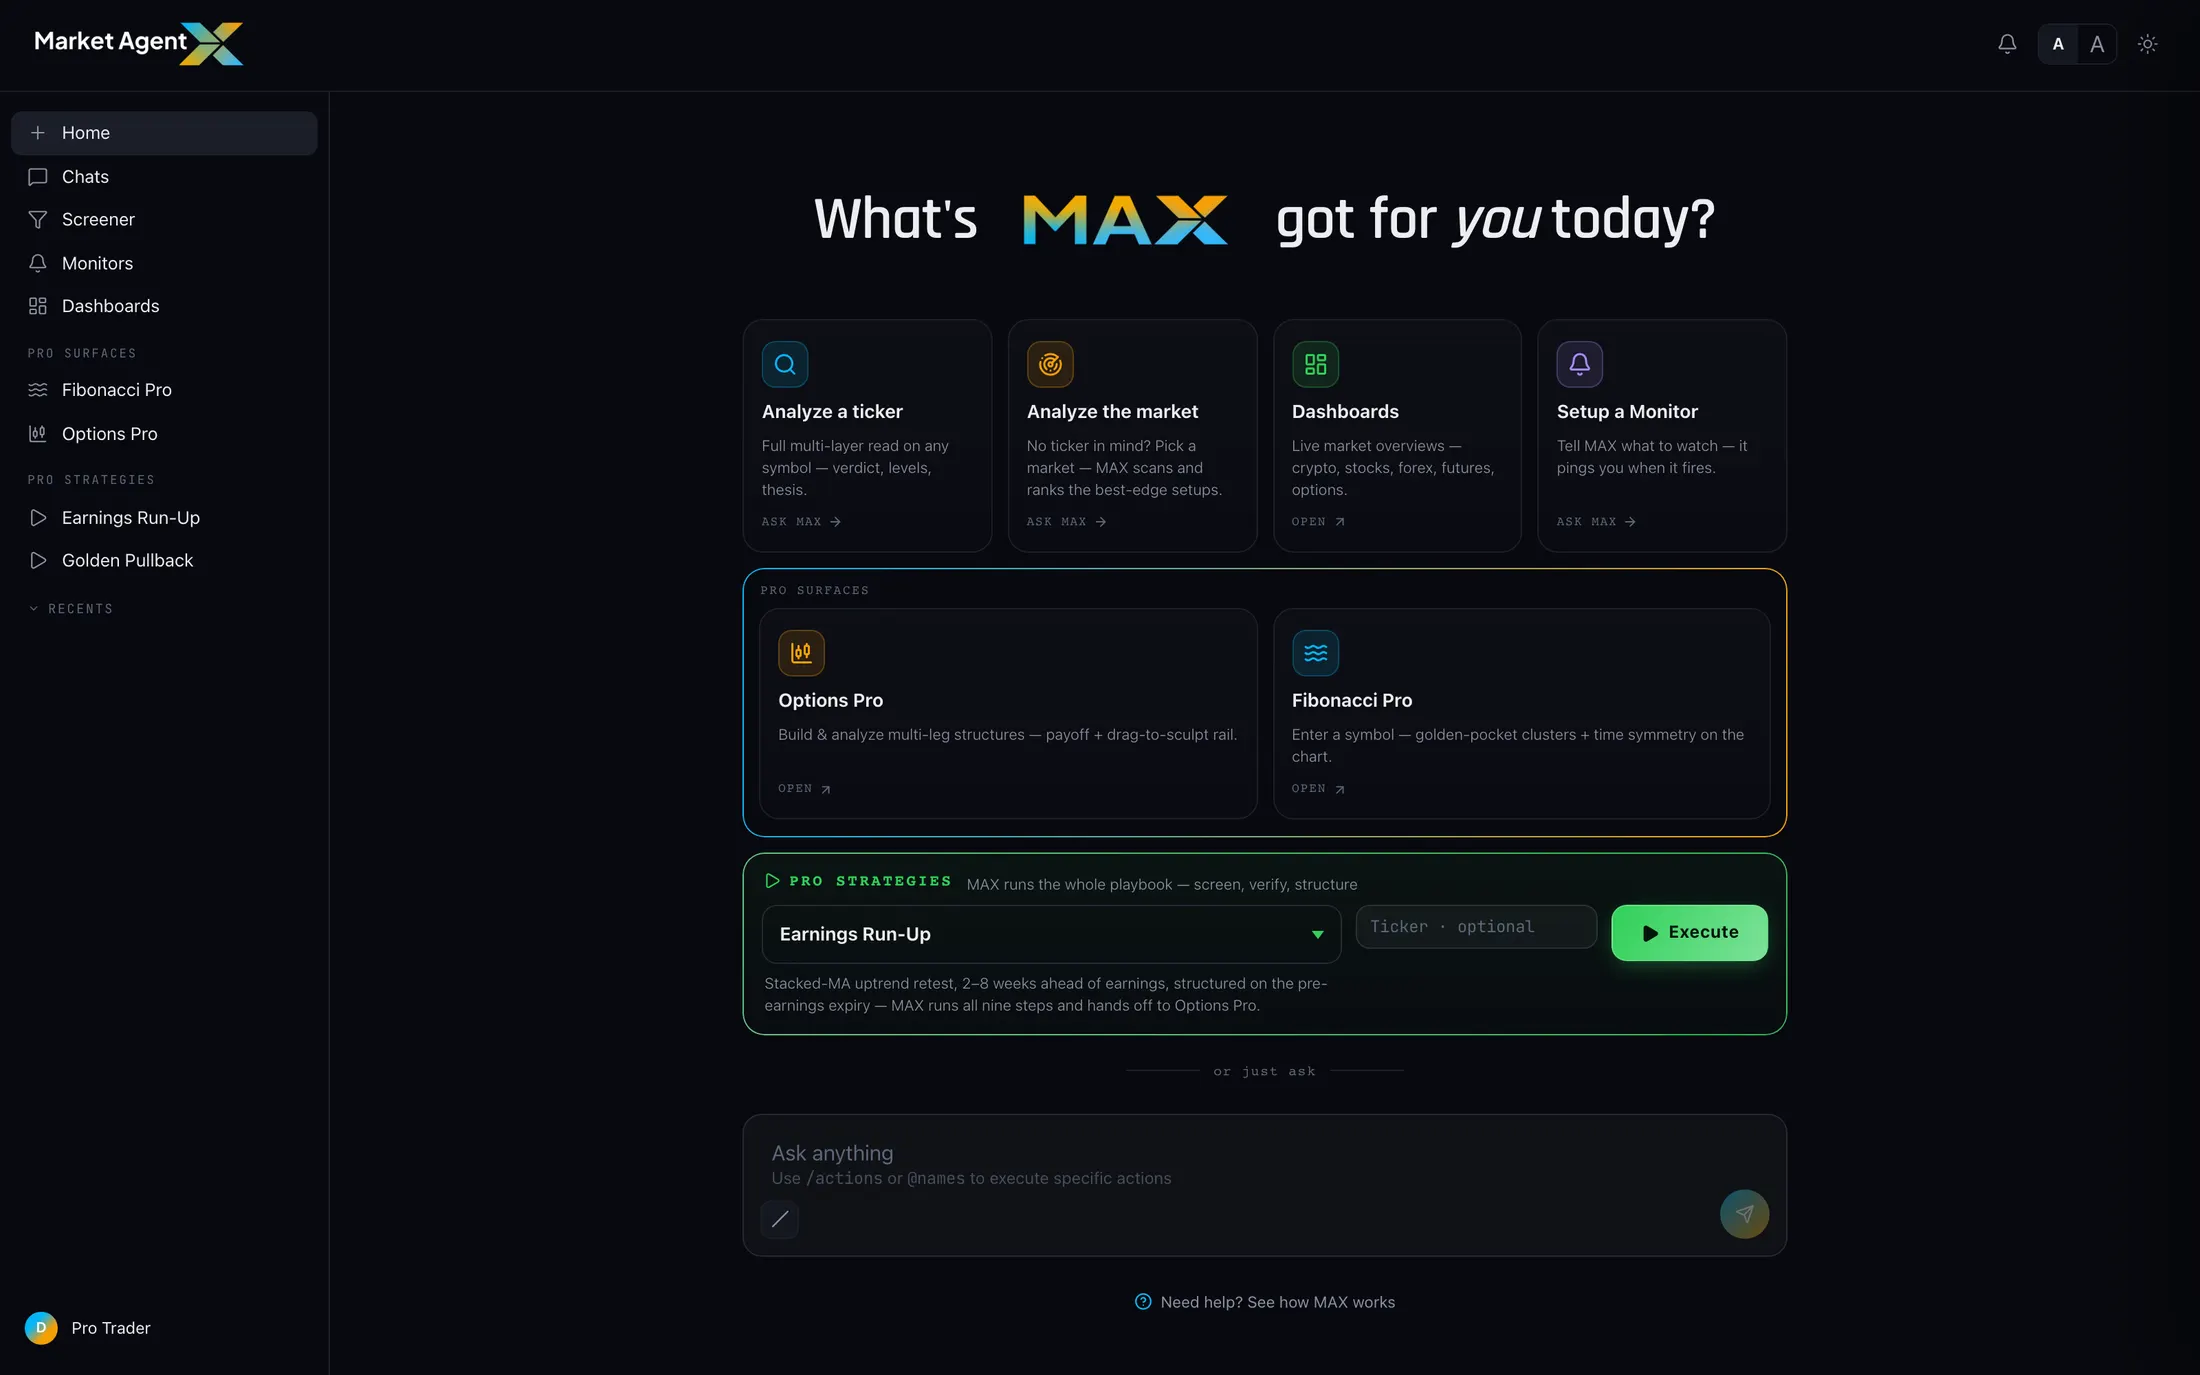
Here's what a market-wide run looks like in practice. You launch it from the chat home box — one click, no configuration — and MAX screens the universe of upcoming reporters, runs the studies on each, and returns a ranked candidate table with the checks shown per name.
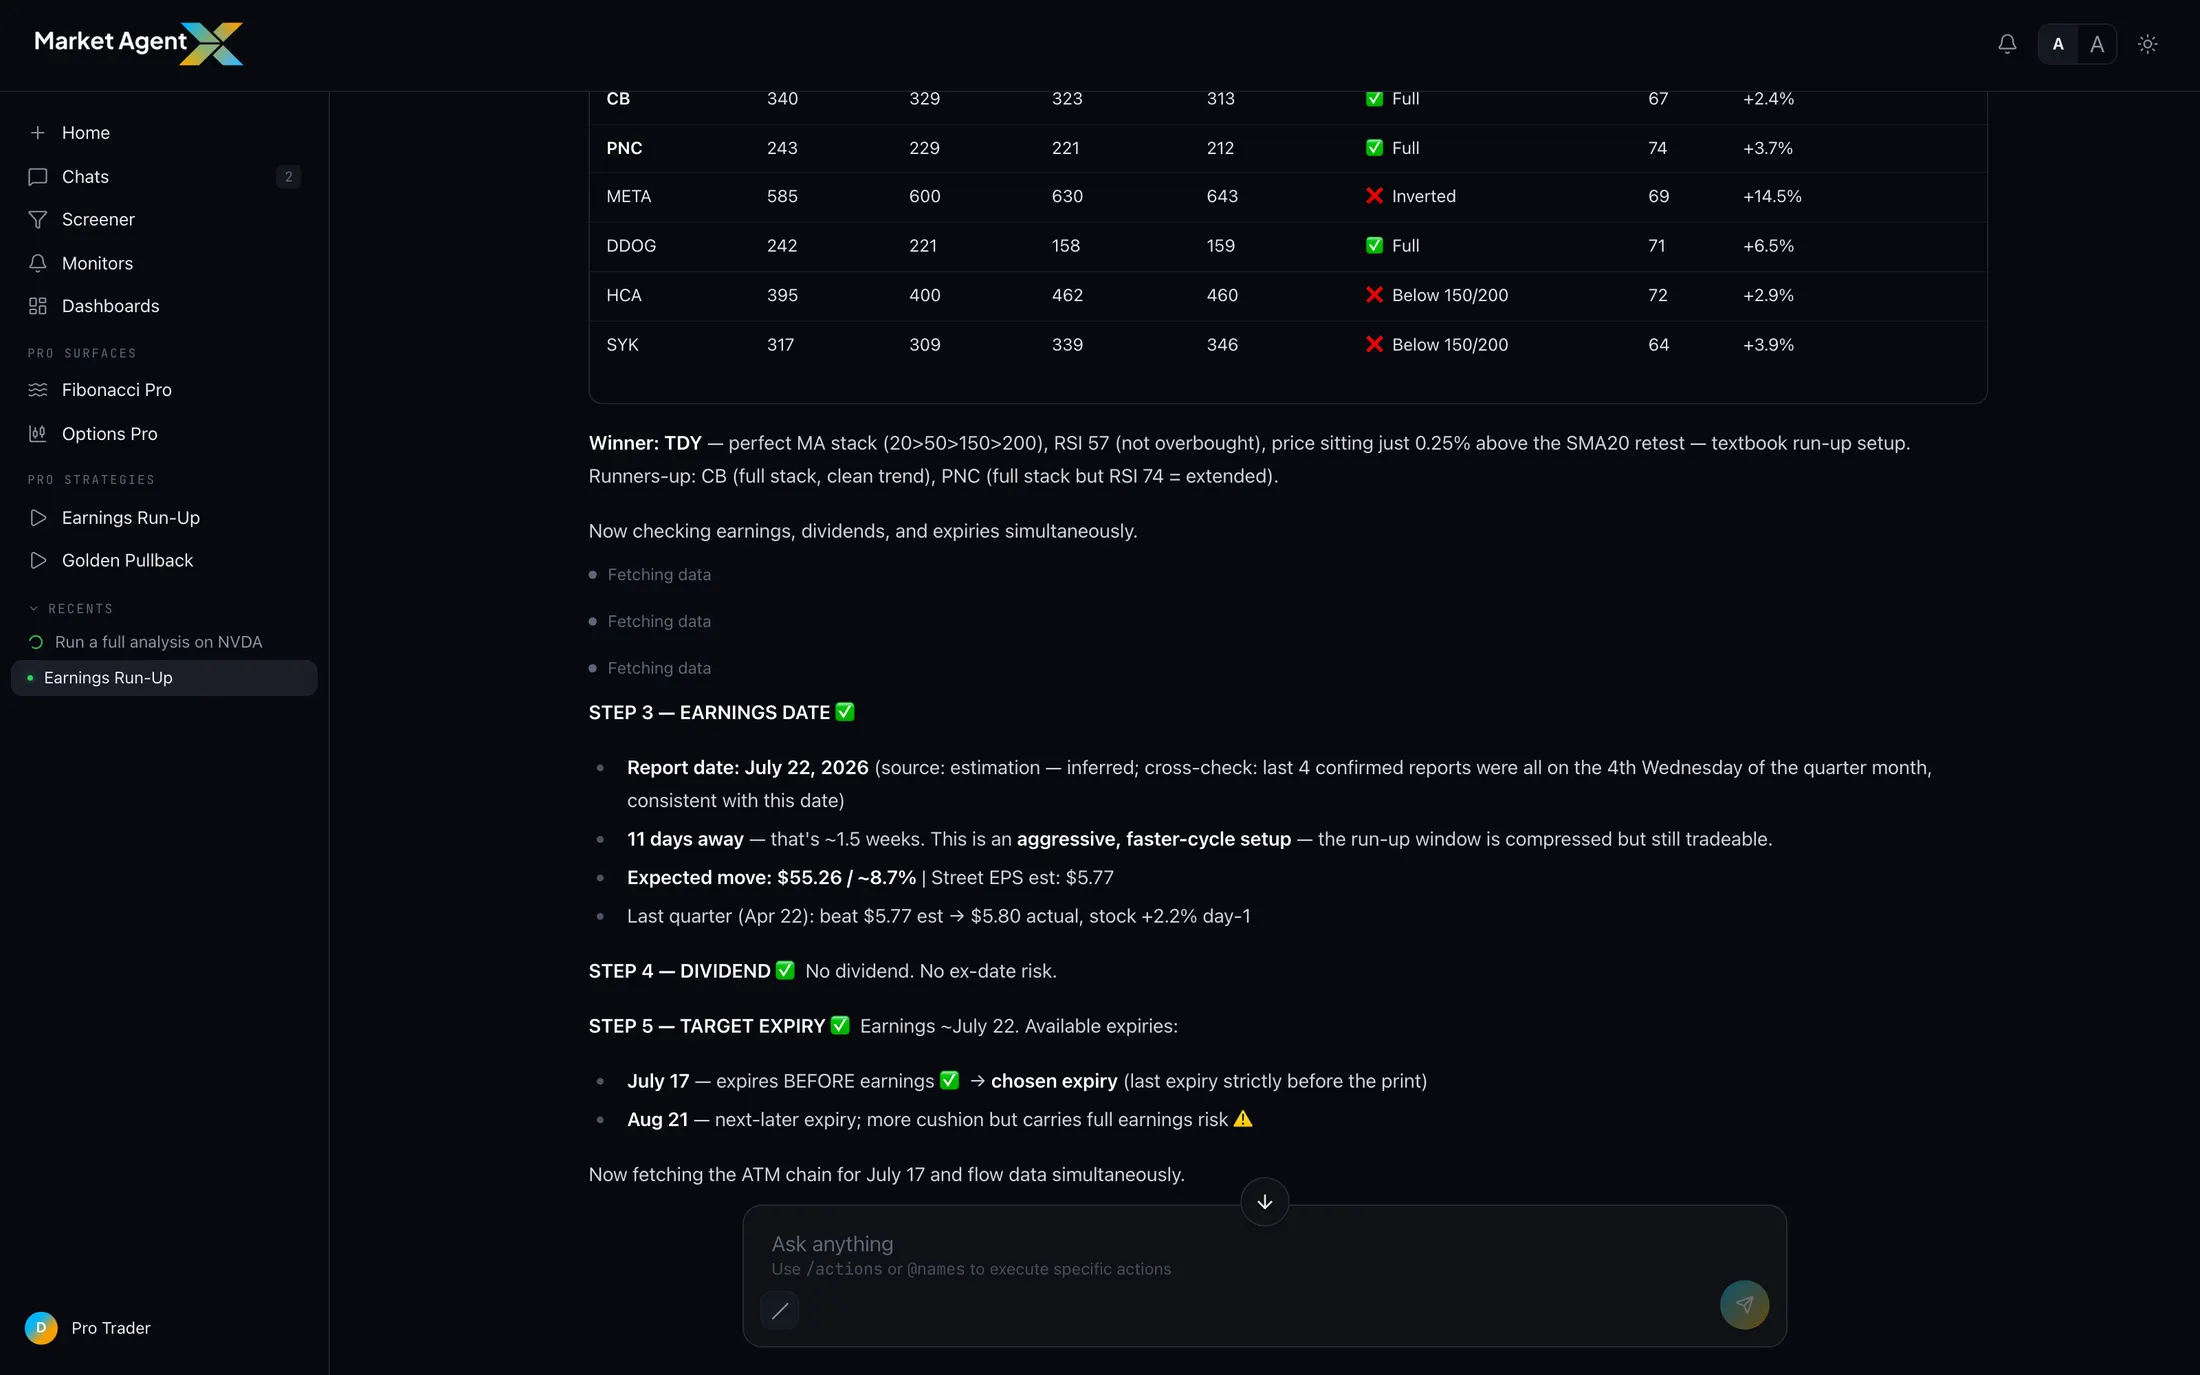
On this run, the name that cleared every study was TDY — Teledyne. The stack check came back full: 20-day above the 50, 50 above the 150, 150 above the 200. Every trend horizon aligned, with roughly eleven days remaining until the report — inside the historically strong window the first study looks for, with enough runway for the pattern to matter.
Then the calendar work, the part most people skip when doing this by hand:
Earnings date confirmed. Expiries listed on both sides of the report. Expected move computed from the live chain. And a short list of structure candidates that fit the window. That's the full pre-earnings work-up — the research that used to take an evening per name — done for every candidate in the run.
A historically strong window tells you when a name has tended to work. The moving-average stack tells you whether the current chart is in any condition to repeat it. Requiring both is the difference between a seasonal study and a seasonal superstition.
Where the run hands off: Options Pro
The candidate table is the end of the screen and the beginning of the study. Each structure candidate carries straight into Options Pro — the live chain and flow for the name, the visual multi-leg builder, and payoff modeling against the expected move you just saw. You can pressure-test a candidate structure across the expiries that bracket the report, adjust strikes on the payoff diagram, and export the result to your platform when you're done. The strategy proposes; the workspace is where you decide.
Market-wide or one ticker
Two ways to run it, both from the chat home box:
- Market-wide: screen the whole universe of upcoming reporters and let the studies rank what's left. Best when you want the calendar to bring you ideas.
- Single ticker: already watching a name into its report? Run the strategy on just that symbol and get the same full work-up — window, stack, calendar, expected move, structures — for one chart.
A historically strong pre-earnings window is a tendency, not a promise. Sample sizes per name are inherently small — a company only reports four times a year — and past windows carry no guarantee about the next one. Earnings Run-Up compresses the research; it doesn't remove the judgment. Treat every run as a starting point for study, not a conclusion.
Run the method, not the spreadsheet
One click screens the pre-earnings universe and runs every study on every candidate. Start your 7-day trial and launch your first run from the chat home.
Start 7-Day Trial →