Fibonacci analysis has a reputation problem, and it's earned. Most implementations are a drawing tool: drag from a low to a high, get five dashed lines, squint until one of them looks important. Practiced that way, it deserves the skepticism.
The professional version of the method is a different discipline entirely. It's not about any single level — it's about confluence: the zones where many independent measurements, taken from different swings and different techniques, land on top of each other. And it's not only about price — the same ratios project time, marking windows on the calendar where trends have historically turned. Fibonacci Pro is that discipline codified into a workspace. Here's how each piece works.
Price confluence: clusters, not lines
The foundation of the method is simple to state: one Fibonacci level is noise; five landing in the same zone is structure.
Fibonacci Pro takes the significant swings on the chart and runs the standard measurement set across them:
- Retracements — how far a pullback has traveled into the prior move (38.2%, 50%, 61.8%, 78.6%).
- Extensions — projections beyond a completed move, used for objectives (127.2%, 161.8%).
- Price projections — measuring one swing and projecting its length from another point, the "measured move" in ratio form.
Each technique applied to each swing produces its own set of levels. Run them all and you get dozens of measurements on the chart. Most scatter. The interesting moments are where they don't — where a 61.8% retracement of one swing, a 127.2% extension of another, and a 100% projection of a third all land within a tight band. That's a confluence cluster, and the surface computes and draws these zones for you, ranked by how many independent measurements stack inside them.
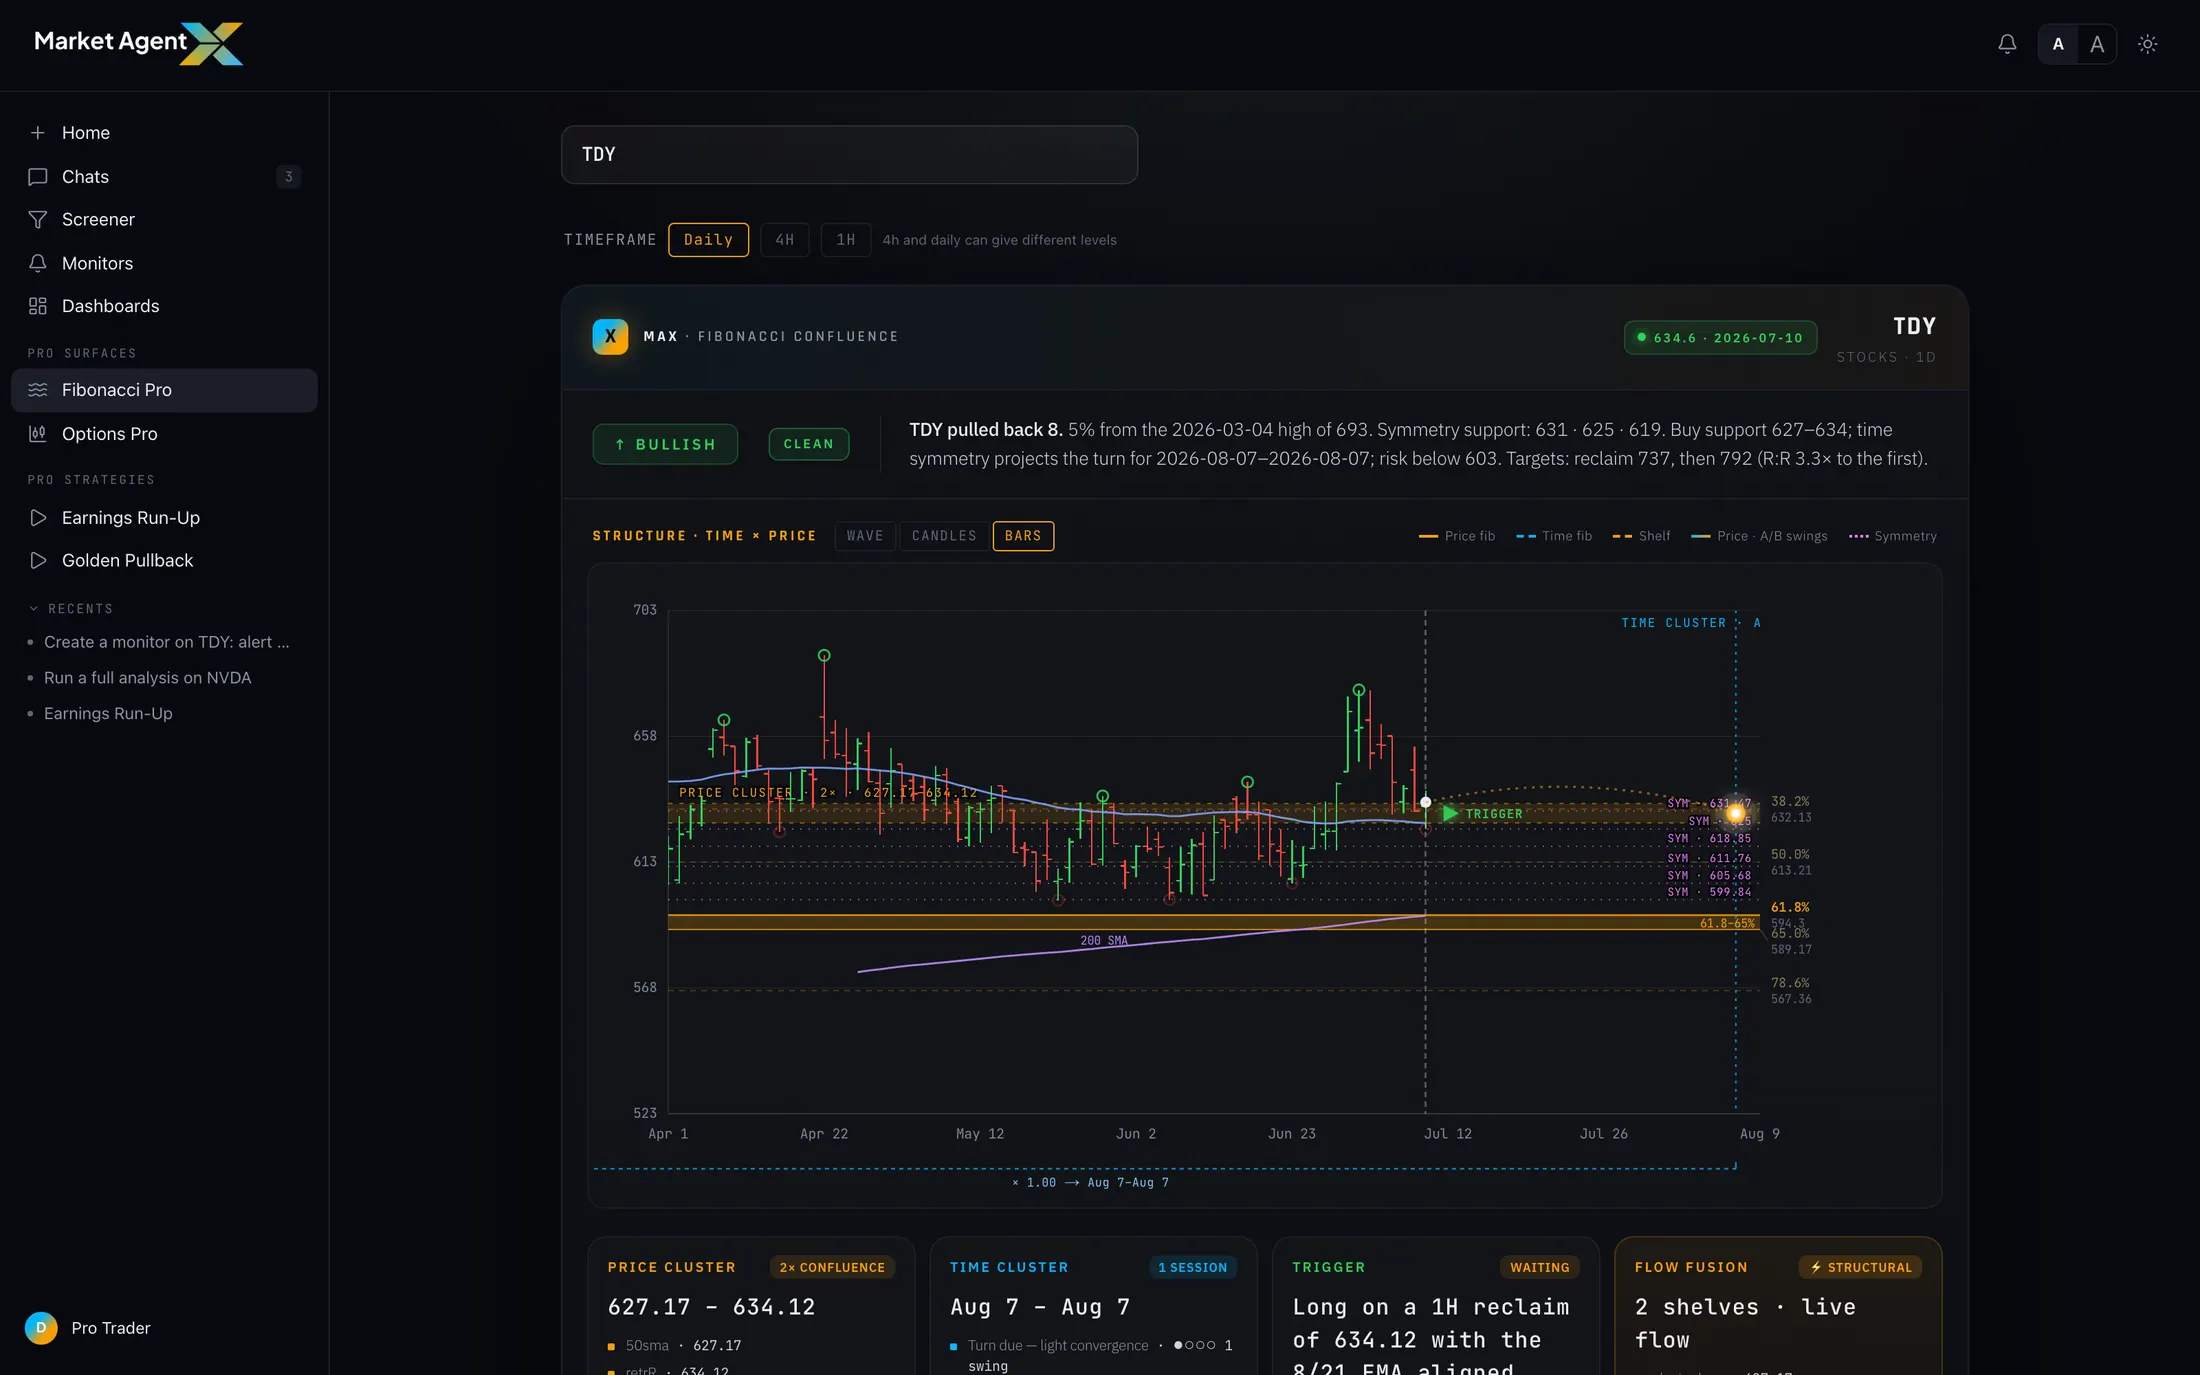
One zone gets special attention in the method: the band between the 61.8% and 78.6% retracements, often called the golden pocket. Practitioners treat it as the deepest a pullback can travel while the prior trend's structure stays intact. When a golden pocket also sits inside a multi-measurement confluence cluster, that's the highest-quality zone the price side of the method produces. It is a place to pay attention — not a guarantee of a turn.
Time: cycles and windows
This is the half of the method most tools skip, and the half practitioners consider indispensable. The same ratios that measure price distances also measure durations. If a decline ran 21 trading days, the method projects 0.618×, 1.0×, and 1.618× of that duration forward from the low. Do this across every meaningful swing and, just like price, most projections scatter — but some cluster.
Where several time projections land in the same few sessions, Fibonacci Pro marks a timing window on the chart's time axis. The reading discipline matters here:
- A timing window is a when to watch, not a what will happen. It says trend changes have historically clustered around this date range on this chart — nothing more.
- Windows are ranges, not dates. Time symmetry is looser than price symmetry, so the surface draws windows a few sessions wide rather than pretending to day-level precision.
- A window with no price setup beneath it is just a calendar entry. The signal quality comes from alignment.
The structure–time–price view
Alignment is the whole game, so the surface's central display puts all three dimensions on one chart: market structure (the swings themselves and the trend they define), the price clusters on the vertical axis, and the time windows on the horizontal. You're looking for the moments the dimensions agree — price entering a ranked confluence zone while a timing window is open while structure says the move that created the zone is still intact.
Three-way alignment is uncommon. That's the point. The method is a filter that stays silent most of the time, and the surface is honest about that silence — it will happily show you a chart with no aligned setup, because "nothing here yet" is a legitimate research result.
Your swings, honored
Here's the design decision that most separates Fibonacci Pro from an automated widget: swing selection is judgment, and the surface treats it that way.
Every measurement in the method anchors to a swing high or swing low, and reasonable practitioners disagree about which swings matter — is the anchor the intraday spike or the closing extreme? The February low or the deeper January one? An algorithm has to pick; a practitioner decides. Fibonacci Pro computes a full automated read so you're never starting from a blank chart, but when you select your own anchors, every cluster and every timing window recomputes from your swings. The surface does the arithmetic; the analytical judgment stays yours. That's how the professionals who shaped this surface insist on working, and the tool follows the practice.
Every market, same method
The mathematics doesn't care what's trading, so the surface doesn't either. Fibonacci Pro runs on stocks, futures, forex, and crypto with the same measurement engine and the same display.
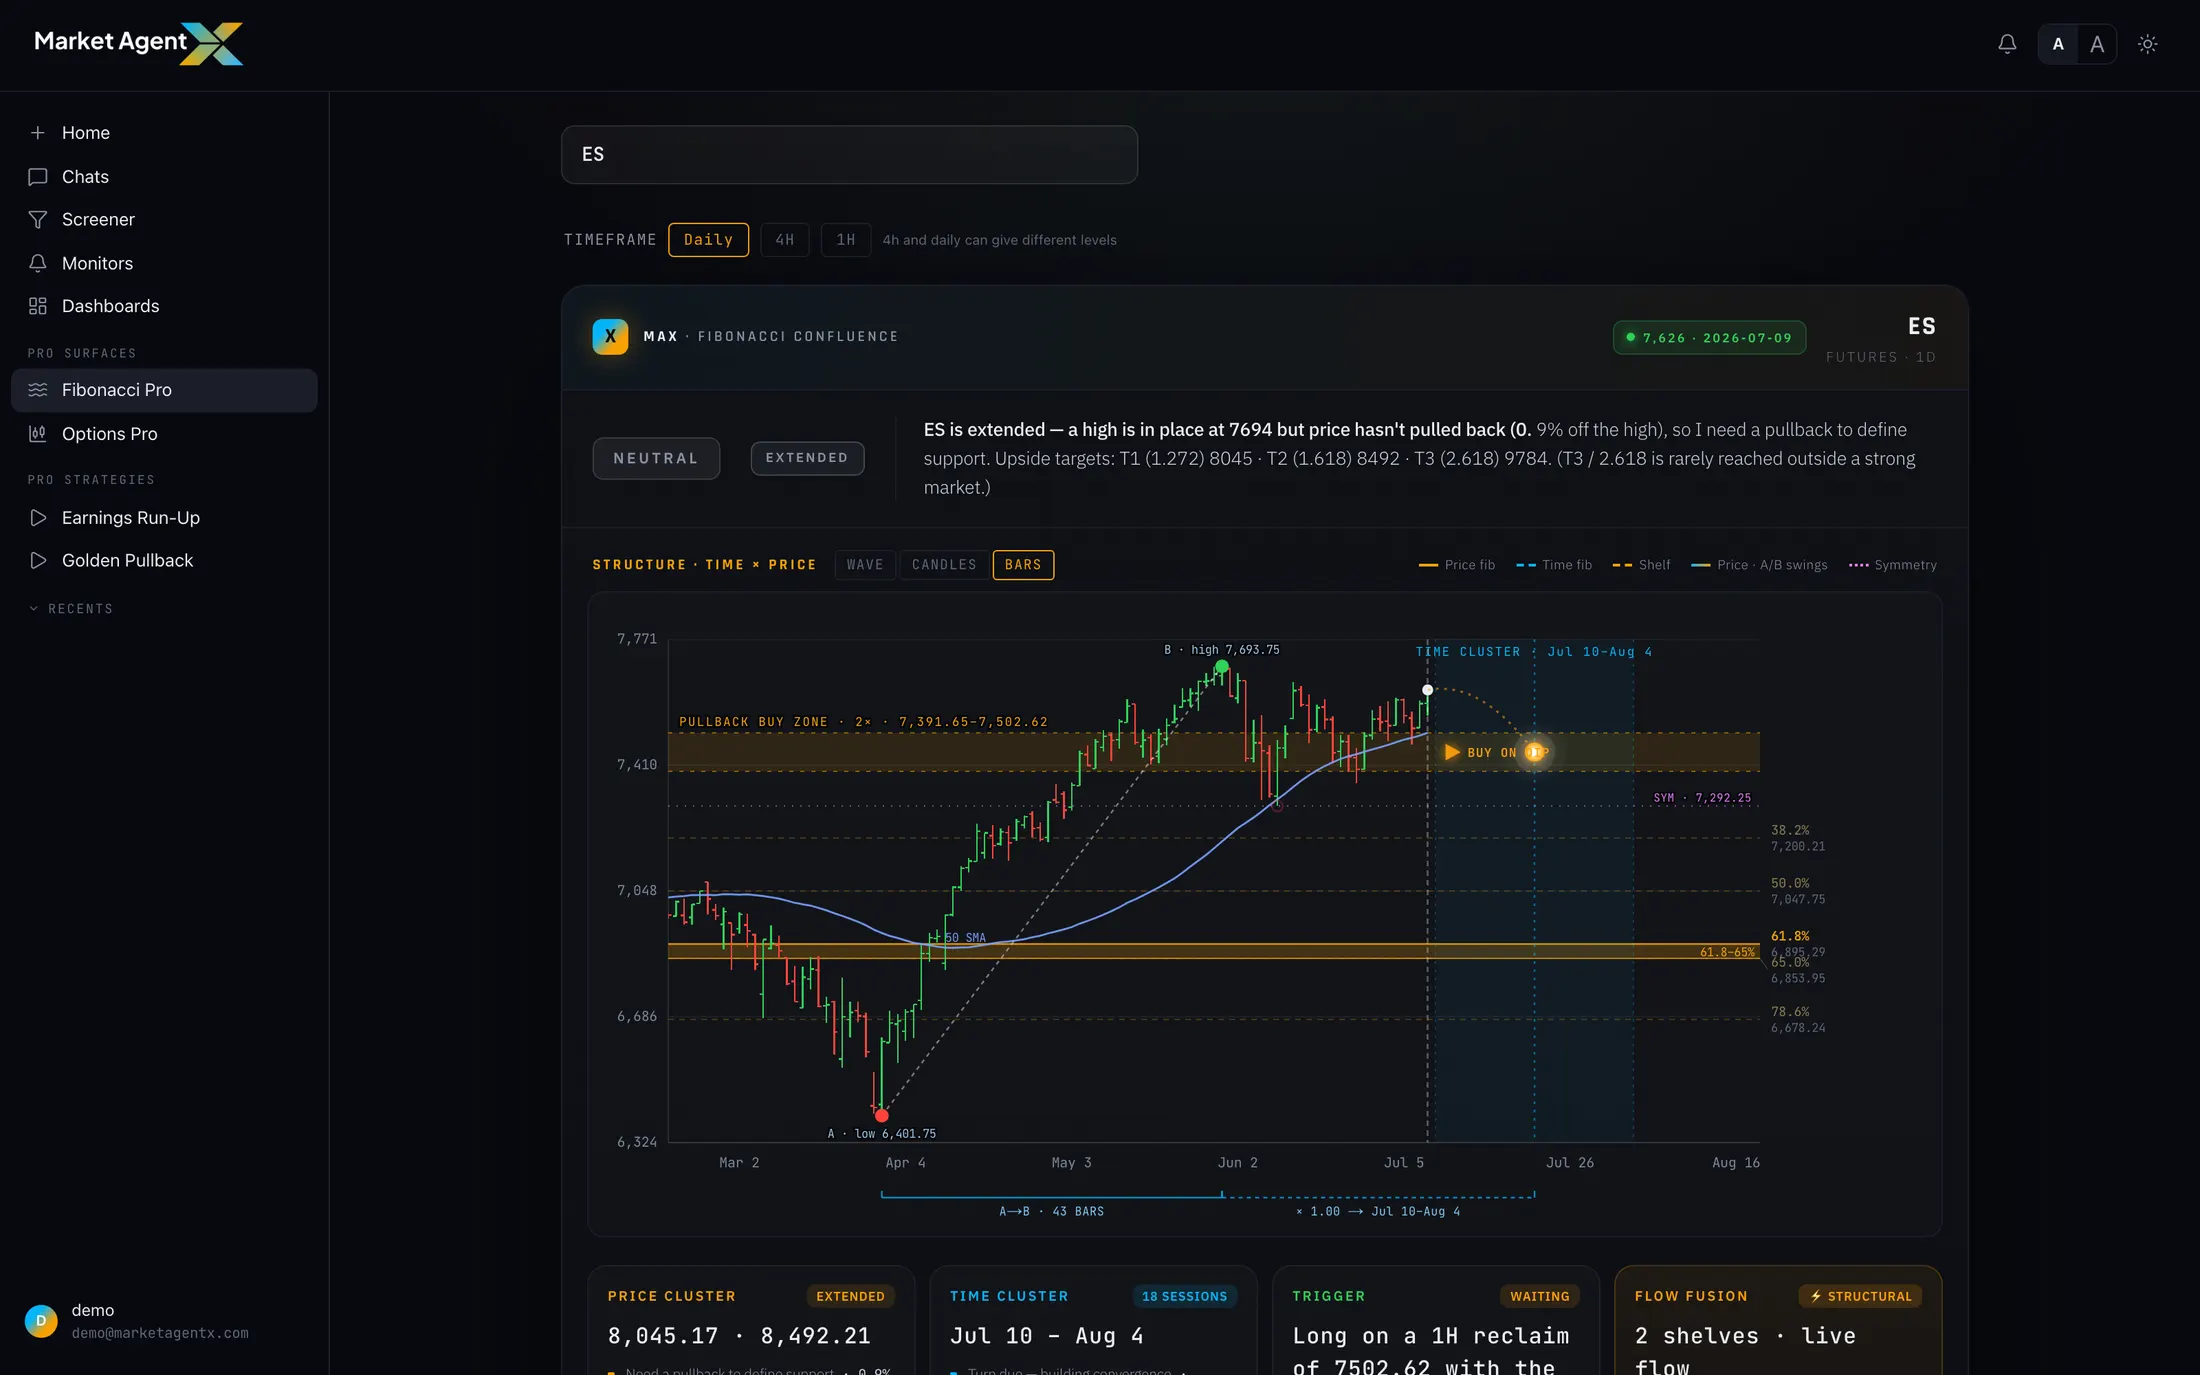
What changes across markets is character, and the surface leaves room for it. Futures and forex trade nearly around the clock, so their swings and time counts read differently from a stock's session-bound chart; crypto's volatility produces deeper retracements and wider zones. The method's rules stay constant — where the swings come from is what varies.
A working session, end to end
Load a symbol and read the structure
Open Fibonacci Pro on the name you're studying. Before any measuring: what's the trend, and which swings define it?
Review the clusters — then set your anchors
Start from the computed confluence zones, then adjust the swing anchors to match your own read. The zones and windows recompute from your selections.
Check the time axis
Is a timing window open now, or approaching? A strong price cluster with a window weeks away is a study to revisit, not a setup to act on.
Hand the level to a monitor
When a zone matters, you don't have to babysit it. Set a monitor in plain English — "alert me if TDY trades into 612–618" — and MAX watches the level while you work on the next chart.
Confluence zones are areas of interest, not predictions. Price slices through well-formed clusters regularly — that's information too, and often the more important kind, because a zone that fails cleanly tells you the structure that built it is gone. The method's value is in structuring where and when you pay attention, and in giving you a precise definition of "wrong."
Study price and time on one chart
Confluence clusters, timing windows, and symmetry — computed for you, anchored to your swings, across stocks, futures, forex, and crypto. Start your 7-day trial and open Fibonacci Pro.
Start 7-Day Trial →